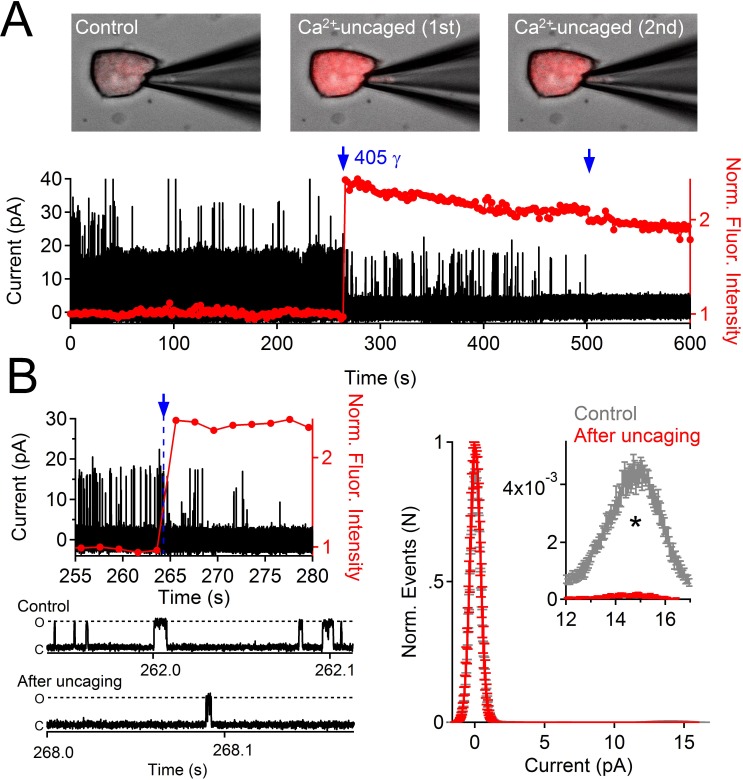
Figure 3. Uncaging internal Ca2+ blocks outward single channel openings.
(A) Outward PKD2-L1 single channel events measured in the on-cell configuration; holding potential = 80 mV. Ca2+ dependent fluorescence was measured using Fluo-3; internal Ca2+ was caged with NP-EGTA. Blue arrows indicate the time points at which Ca2+ was uncaged using a 1 s 405 nm UV pulse. Images before and after uncaging are shown above the single channel record. (B) Expanded time scales of the record in A, illustrating the rapidity of current block. Right, Normalized open probability histograms measured in control (gray) and after uncaging cytosolic Ca2+ (red). The open probability (Po) of PKD2-L1 was significantly reduced after the UV pulse (N= 4 cells, Error ± SEM; asterisk indicates p<0.005; Prior to UV pulse, Po = 0.0057 ± 0.001; after UV pulse Po = 0.0002 ± 0.0002).

