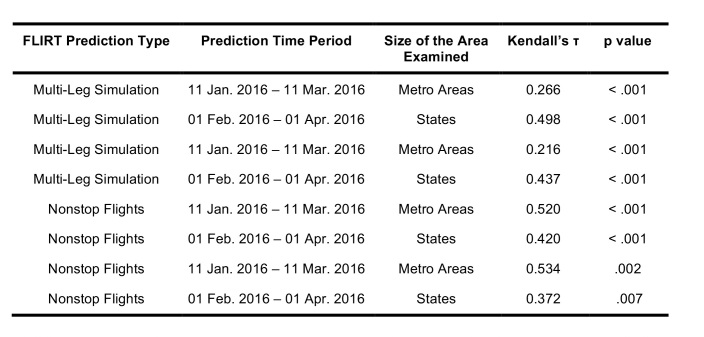
Table 4: A comparison of the ordinal ranks of locations receiving imported cases of Zika virus predicted by FLIRT, the observed time period, and the size of the region analyzed. FLIRT’s nonstop flight and multi-leg simulation were both predictive of where Zika cases were most likely to arrive at the state and metro area levels for the observed time periods.

An official website of the United States government
Here's how you know
Official websites use .gov
A
.gov website belongs to an official
government organization in the United States.
Secure .gov websites use HTTPS
A lock (
) or https:// means you've safely
connected to the .gov website. Share sensitive
information only on official, secure websites.
