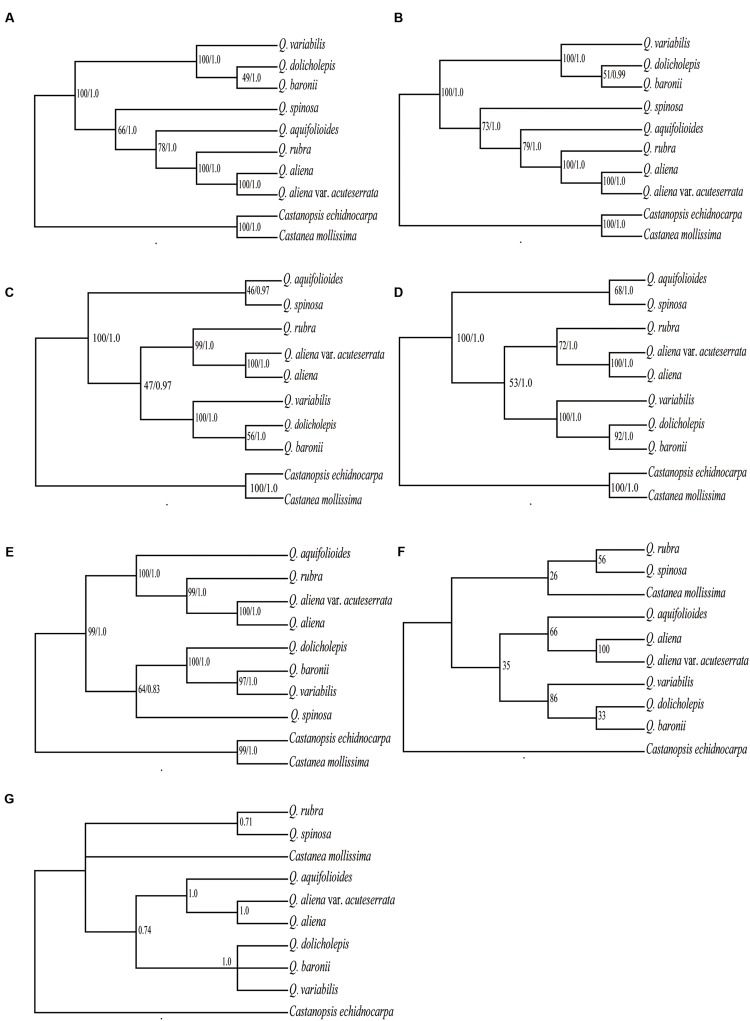
FIGURE 6.
Phylogeny of the 10 Fagaceae species inferred from ML and BI analyses of different data partitions. (A) Whole chloroplast genome. (B) LSC+SSC+IRB region. (C) LSC+SSC region. (D) LSC region. (E) SSC region. (F) ML topology of IRB region. (G) BI topology of IRB region. The numbers associated with each node are bootstrap support values and posterior probability values in (A–E). The numbers associated with each node are bootstrap support values and posterior probability values in (F,G), respectively.

