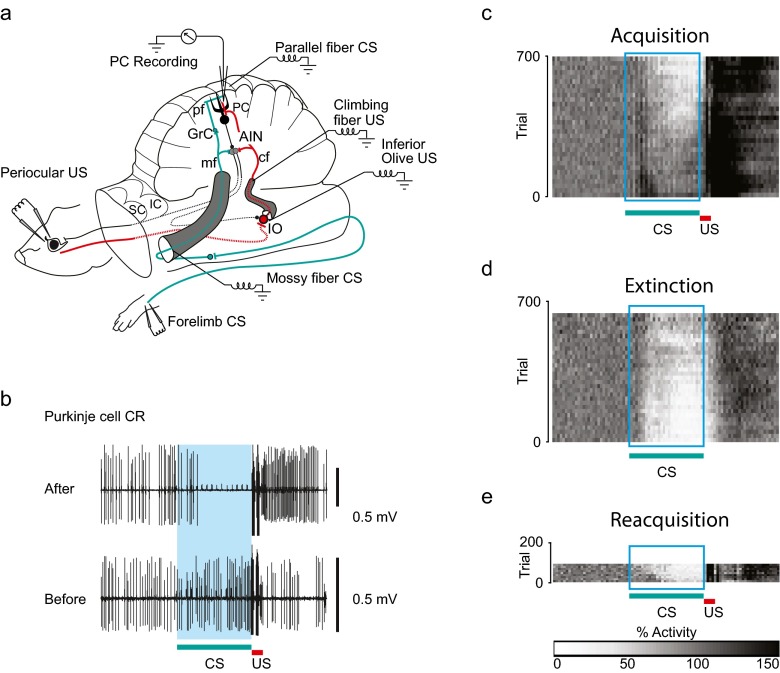
Fig. 2.
The decerebrate ferret setup and conditioned Purkinje cell responses. a Experimental setup. After decerebration by transection rostral to the superior (and inferior) colliculi (SC and IC), the remaining structures—brainstem, cerebellum and spinal cord—remain intact and sufficient for classical conditioning of the eyeblink response. This preparation also allows for recording of neural activity in Purkinje cells (PC) in the cerebellar cortex for several hours when the animal is immobilised. As in Fig. 1a, interneurons (In), granule cells (Grc), anterior interpositus nucleus (AIN) and inferior olive (IO). The conditional stimulus (CS, in green) was electrical stimulation applied to either the forelimb skin or directly to the mossy fibres (mf) in the middle cerebellar peduncle or to the parallel fibres (pf). The unconditional stimulus (US, in red) was electrical stimulation applied to either the periocular skin or directly to the inferior olive (IO) or the climbing fibres (cf) in the inferior cerebellar peduncle. b The conditioned Purkinje cell response (Purkinje cell CR). Simple spike responses recorded extracellularly from a Purkinje cell, before training (bottom) and after 3 h of training (top), using a mossy fibre conditional stimulus (CS) and a climbing fibre unconditional stimulus (US). Before training, the Purkinje cell responds with a slight increase in simple spike activity. After 3 h of paired presentations of the conditional stimulus and the unconditional stimulus, the Purkinje cell has acquired a reliable, long-lasting pause (for more than 150 ms) in response to presentation of the conditional stimulus. The 300-ms interstimulus interval is indicated by the blue shading. c–e Population averages of Purkinje cell simple spike responses to presentations of a conditional stimulus (CS) during (c) acquisition, (d) extinction and e reacquisition. The 300-ms interstimulus interval is indicated by the rectangular box as in (b). Each pixel in the plots illustrates the average simple spike activity for the population of Purkinje cells that was studied, in a 10-ms time window averaged over 20 trials for each cell. The bar below (e) indicates the correspondence between grey scale and simple spike activity, normalised relative to the background simple spike activity in the population. White indicates 0 % simple spike activity and black indicates a 150 % increase in activity compared to background. Adapted from [49, 52]

