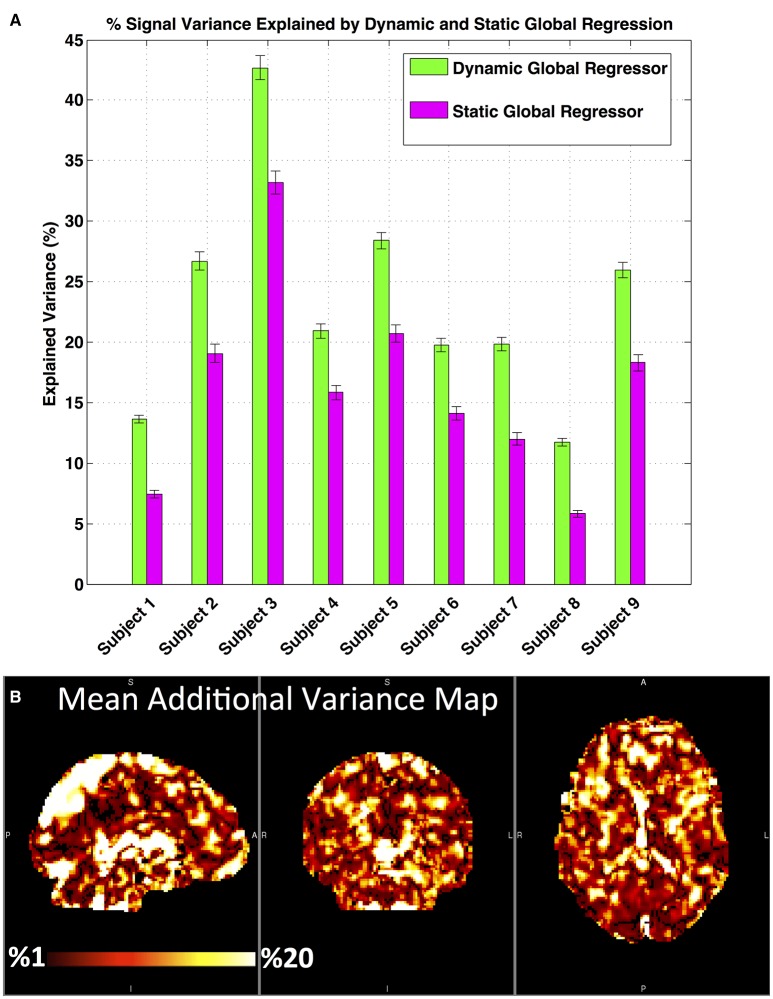
Figure 5.
Percentage signal variance explained by sGSR and dGSR methods. dGSR explains variance in the data to a greater extent when compared to sGSR. (A) Mean % signal variance explained by dynamic and static global regressors. Error bars represent standard error of the mean. (B) A spatial map of the mean additional variance explained by voxel-wise optimally delayed (dynamic) global regressor and the static global regressor, averaged over all subjects.

