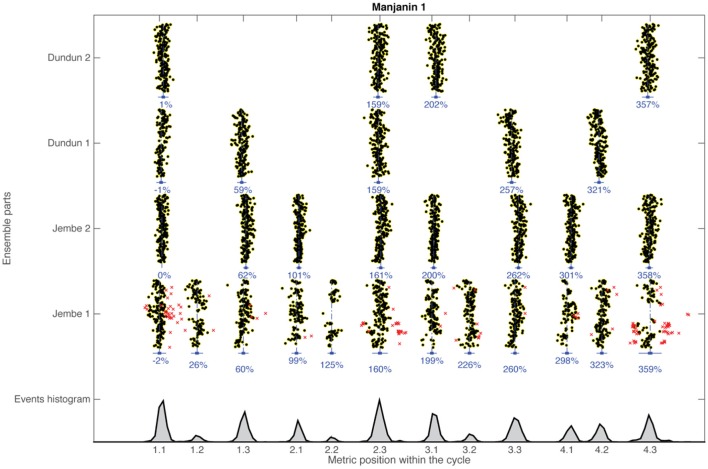
Figure 2.
Top all 5393 onsets of four ensemble parts aligned to the average downbeat (Pulse 1.1) in a sample recording (Manjanin 1). The distribution of onsets within the metric cycle is plotted on the x-axis; the course of absolute time (sequence of metric cycles) is plotted on the y-axis for each ensemble part. Numbers below each vertical extension give the mean distributions of onsets for each metric position relative to the four-beat cycle (= 400%). Ornamental filtered events are marked with red crosses. Bottom shows the histogram of all events included in the piece. Histogram peaks correspond to the locations of metric subdivisions.

