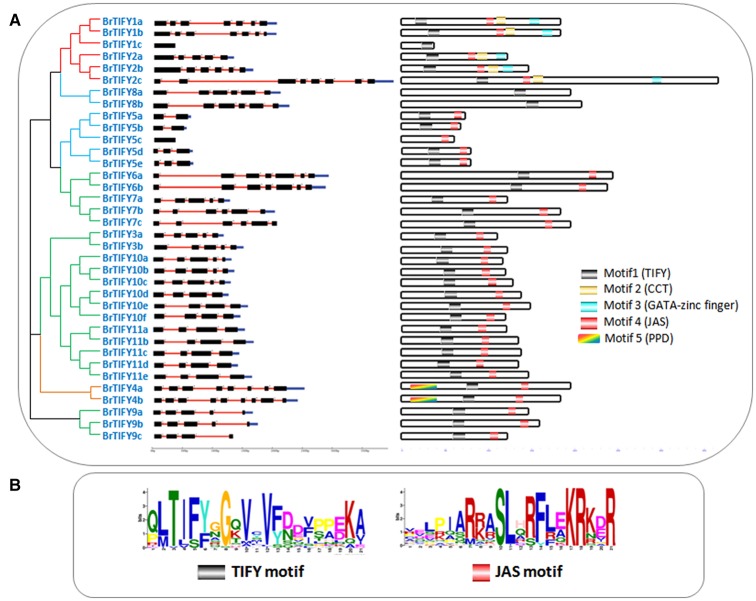
Figure 2.
(A) Showing schematic representation of intron-exon distribution and motifs identified in B. rapa TIFY proteins. Intron–exon organization patterns of 36 TIFY genes are shown, along with their intron splicing patterns. On the right, different motifs (motif 1–5) are indicated by different colors, and the names of all members are shown on the left side of the figure, along with their phylogenetic relatedness, and (B) showing two motif logos (“TIFY” and “Jas”) with their amino acid conservation patterns.

