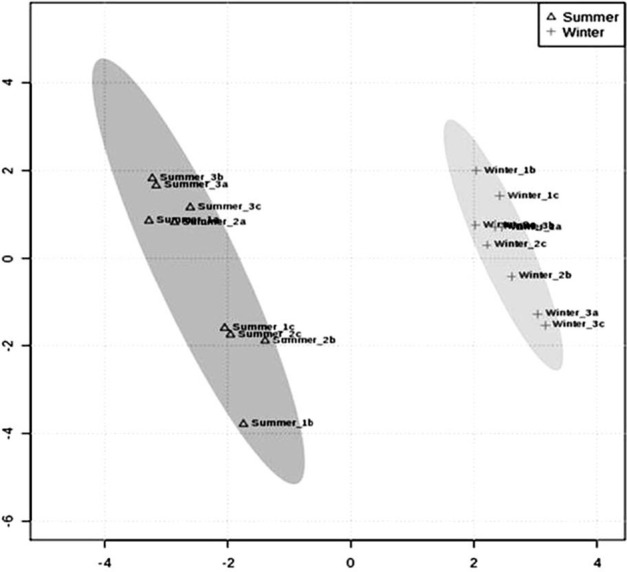
Figure 3.

PLS-DA score plots of eucalyptus cambial zone showing a significant separation (R2 = 0.99 and Q2 = 0.98) between summer (square) and winter (circle) samples. The x-axis represented the modeled co-variation and the y-axis is the predictive component. Component 1 and 2 contributes with 43.4 and 16.89%, respectively, of the total variance. Three biological replicates, each with three technical replicates were analyzed per sample.
