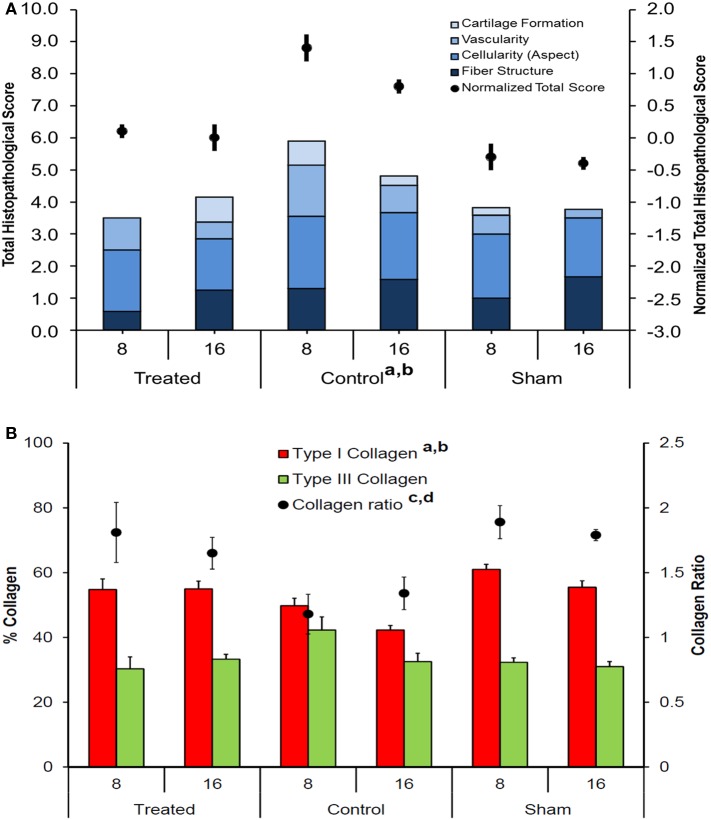
Figure 8.
(A) Stacked histograms of the semiquantitative histomorphometric score for treated, control, and sham groups, including cartilage formation, vascularity, cell aspect, and fiber structure scores (Mean, n = 5). Dots represent the normalized total score for healthy tendon score for each group (mean ± SEM, n = 5); adjusted Bonferroni t test: treated versus control group (ap < 0.005); control versus sham group (bp < 0.0005); (B) Histograms of Type I and Type III collagen content, expressed in percentage, for treated, control, and sham groups (mean ± SEM, n = 5). Dots represent the Collagen Ratio (Type I/Type III) for each group (mean ± SEM, n = 5); adjusted Bonferroni t test: treated versus control group (ap < 0.05) and control versus sham group (bp < 0.005).

