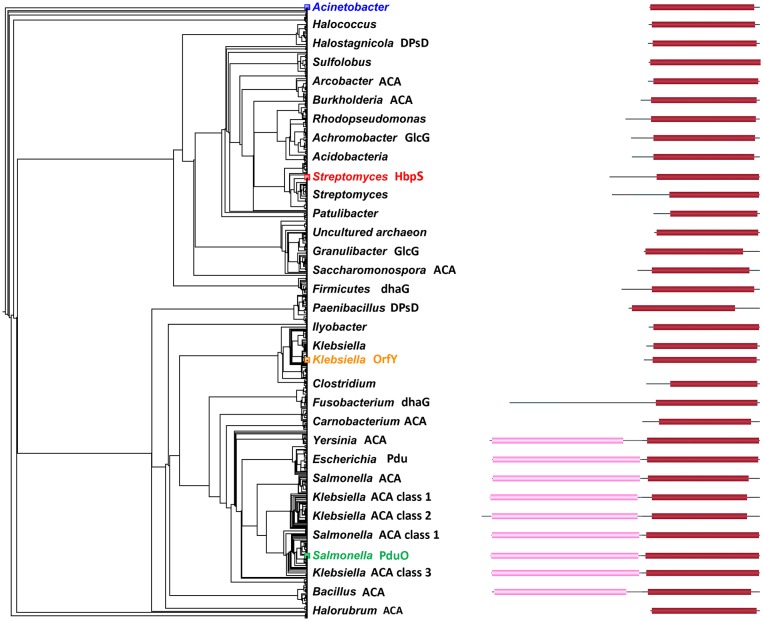
Figure 2.
Maximum likelihood phylogram of 1102 PduO-like sequences. Only representative nodes are labeled. Domain structure is shown by blocks on the right with length corresponding to sequence length. Pink regions are ACA domains. Red regions are homologous to PduO C-terminus. Black lines are unannotated regions. Actinobacter is colored, as it was used to root the tree. Other colored labels show the reference/starting sequences. The domain structures come from searching with all sequences against the NCBI domain database (Marchler-Bauer et al., 2005).

