Figure 4.

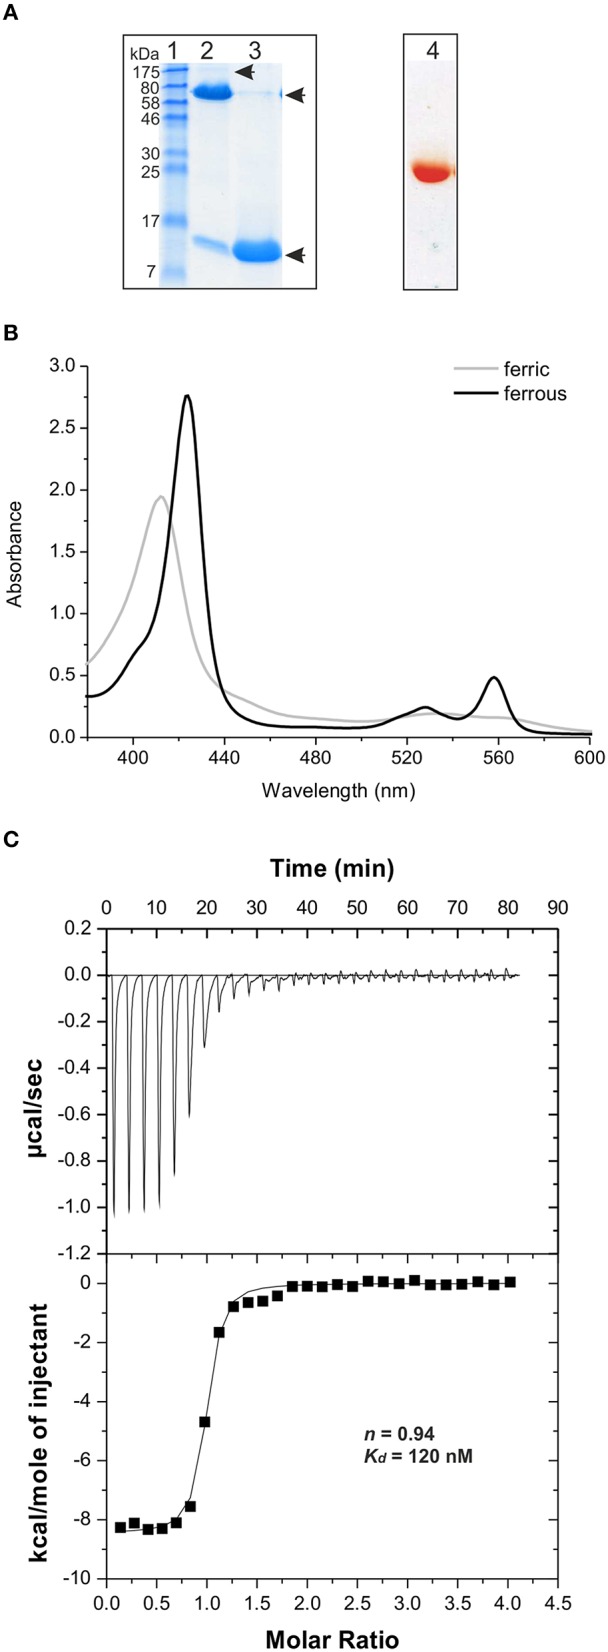
Analysis of heme binding by PduOC. (A) An unboiled (lane 2) and boiled (lane 3) aliquot (15 μg) of the isolated PduOC protein were analyzed by SDS-PAGE. The proteins were stained using PageBlue. The molecular weigth (in kDa) of protein markers (lane 1) is indicated. The arrows indicate the observed protein bands. The PduOC aliquot was aditionally analyzed by native PAGE (lane 4). After electrophoresis the native gel was scanned. (B) Isolated PduOC (50 μM) was analyzed by UV/Vis spectroscopy. The spectrum of the ferric (gray) and ferrous (black) form of PduOC-bound heme are indicated. (C) Binding isotherm for PduOC apoprotein titrated into heme. The apoprotein was injected stepwise (30 × 10 μl) into a cell containing heme (20 μM) at 25°C. Upper panel: Heat evolved upon injection of the apoprotein into heme as a function of injection order. Lower panel: Integrated heats of reaction plotted against the molar ratio of PduOC apoprotein to heme concentration. The best fit to the data according to a model assuming a single set of identical sites is indicated by a solid line. The calculated stoichiometry value n as well as the dissociation constant Kd are indicated.
