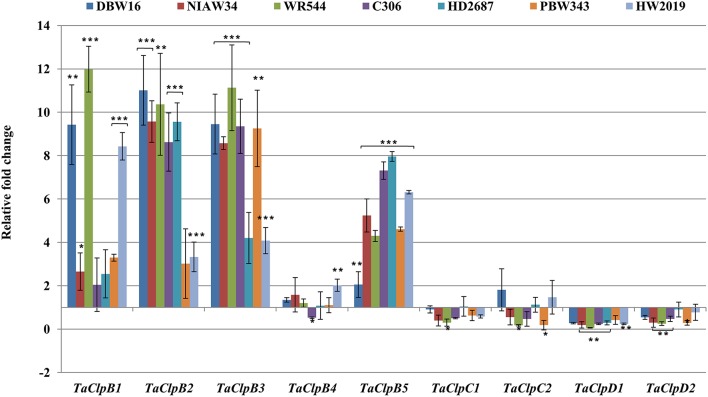
Figure 6.
Expression levels of TaClpgenes under high temperature stress. High temperature stress was imposed to 15 days old seedlings at 42 ± 2°C for 3 h. Error bar represents standard deviation of three biological replicates. p value is calculated using two tailed unpaired t-test, *p < 0.05, **p < 0.01, ***p < 0.001.

