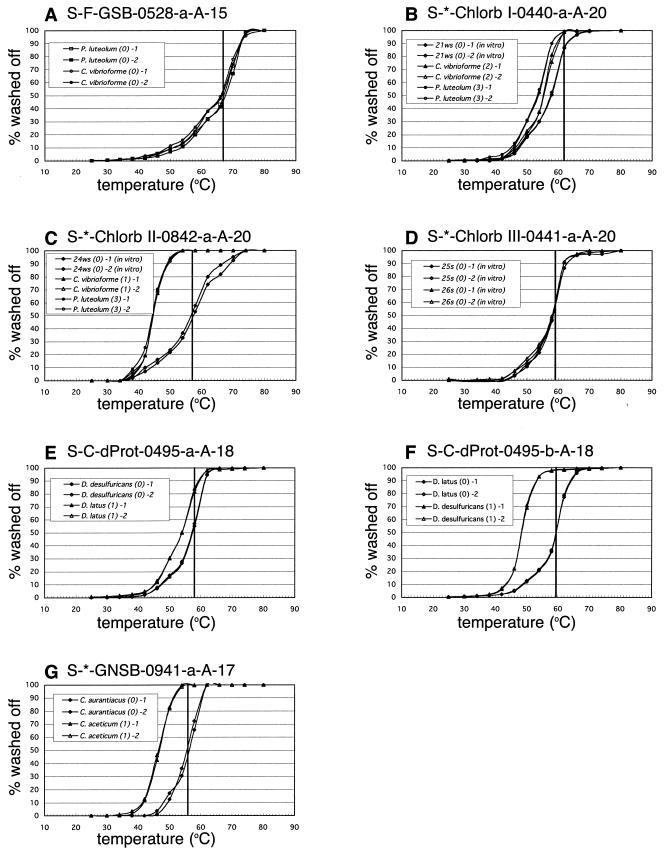
FIG. 3.
Normalized Td curves determined by using intact RNA or transcribed RNA (positions 338 to 907, E. coli numbering) of target and nontarget microorganisms. (A) GSB528; (B) Chlorb I 440; (C) Chlorb II 842; (D) Chlorb III 441; (E) DELTA495a; (F) DELTA495b; (G) GNSB941. Vertical lines indicate the final Tws of individual probes.

