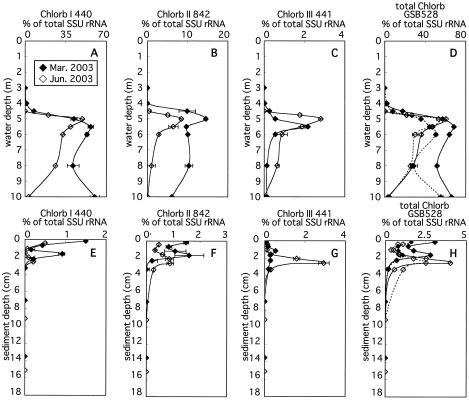
FIG. 5.
Vertical profiles of abundance of SSU rRNA hybridizing with Chlorb I (A and E), II (B and F), and III (C and G) group-specific probes, with the cumulative signals obtained with three specific probes (D and H, solid line) and SSU rRNA of Chlorobiaceae hybridizing with general probe GSB528 (D and H; broken line), relative to total SSU rRNA in the water column (A to D) and sediment (E to H). Horizontal bars indicate maximum and minimum ratios of specific probes to total SSU rRNA.

