
Figure 2.
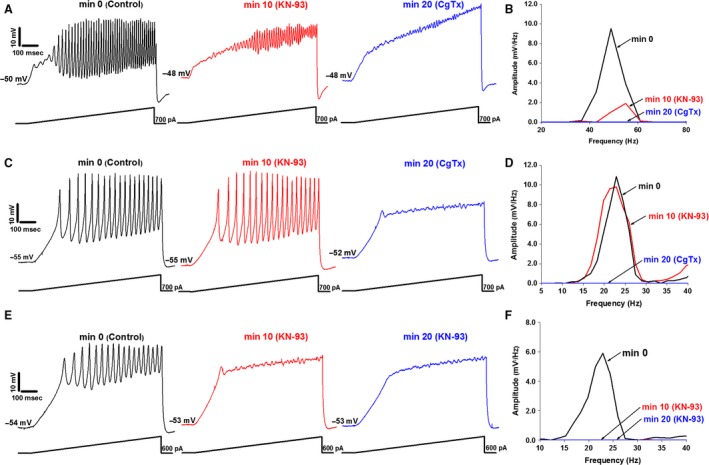
Effects of KN‐93 and CgTx on gamma oscillations. (A) Membrane oscillations recorded in a PPN cell (left, black). Following superfusion of KN‐93 for 10 min, oscillation amplitude was reduced (middle, red). CgTx was then superfused for 10 min, blocking the remaining oscillations (right, blue). (B) Power spectrum of the cell shown in (A) displaying amplitude and frequency of ramp‐induced oscillations before (black), after 10 min of KN‐93 (red, reduced oscillations), and following 10 min of CgTx (blue record, blocked remaining oscillations). (C) Membrane oscillations recorded in a different PPN cell (left record, black). KN‐93 applied to the bath for 10 min caused no significant effect on the membrane oscillations (middle, red). CgTx was then superfused for 10 min, causing a complete blockade of the membrane oscillations (right, blue). (D) Power spectrum from the cell shown in (C) displaying amplitude and frequency of ramp‐induced oscillations before application of agents (black record, beta/gamma range), after KN‐93 (red, no effect), and CgTx (blue record, blocked oscillations). (E) Membrane oscillations recorded in a third PPN cell (left record, black). KN‐93 was applied for 10 min blocking oscillations (middle, red). KN‐93 was superfused for an additional 10 min (right, blue). (F) Power spectrum of the cell shown in (E) displaying amplitude and frequency of ramp‐induced oscillations before application of agents (black), after 10 min of KN‐93 (red record, blocked oscillations), and 20 min exposure to KN‐93 (blue record, blocked oscillations).