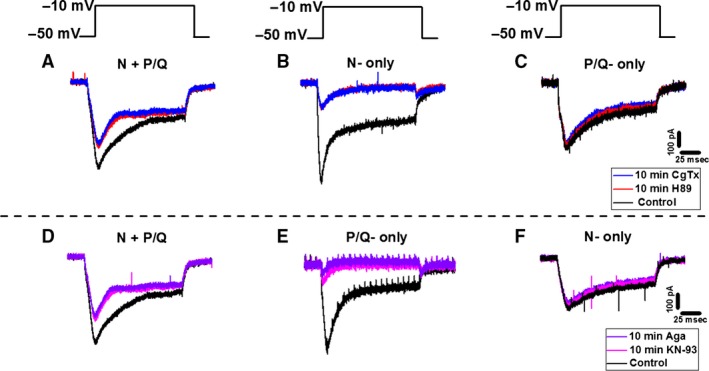
Figure 5.

Control Ca2+ current (IC a) recordings confirming separate intracellular pathways in PPN neurons. All IC a were recorded using a multiple step depolarization protocol starting at −50 mV with 10 mV steps, up to 0 mV. This figure shows only the −10 mV step. (A) IC a recorded from a PPN neuron (probably N + P/Q‐type) before (black), after 10 min of H89 (red, reduction), and 10 min of CgTx (blue, no effect). (B) IC a from a PPN neuron (probably N‐type) before (black), after 10 min of H89 (red, block), and 10 min of CgTx (blue, no effect). (C) IC a recorded from a PPN neuron (probably P/Q‐type) before (black), after 10 min of H89 (red, no effect), and 20 min of CgTx (blue, no effect). (D) IC a recorded from a PPN neuron (probably N + P/Q‐type) before (black), after 10 min of KN‐93 (magenta, reduction), and 10 min of Aga (purple, no effect). (E) IC a from a PPN neuron (probably P/Q‐type) before (black), after 10 min of KN‐93 (magenta, block), and 10 min of Aga (purple, no effect). (F) IC a recorded from a PPN neuron (probably N‐type) before (black), after 10 min of KN‐93 (magenta, no effect), and 20 min of KN‐93 (purple, no effect).
