
Figure 2.
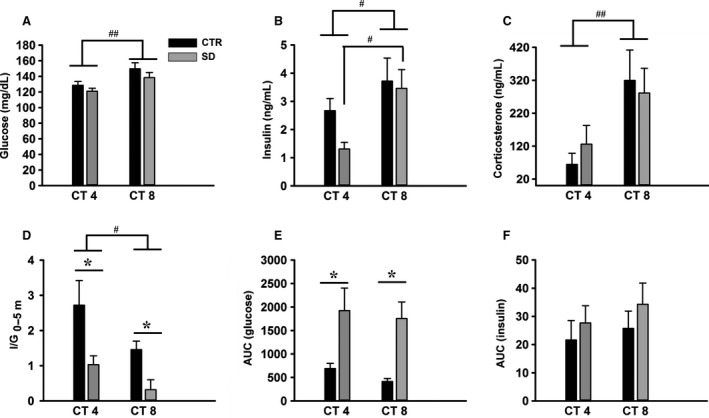
Basal glucose and hormone concentrations during intravenous glucose tolerance tests (IVGTTs) in rats after sleep deprivation (all groups n = 6). (A) Basal plasma glucose concentrations were significantly higher at circadian time (CT) 8 compared to CT4. (B) Basal plasma insulin concentrations were significantly higher at CT8 in the SD group. (C) Basal plasma corticosterone concentrations were significantly higher at CT8 compared to CT4. (D) I/Gt0–5: the ratio of ∆I5‐0 to ∆G5‐0 (∆I5‐0/∆G5‐0 as a measure of the insulin response to glucose in the first 5 min) was reduced significantly after sleep deprivation in the early and late rest period. (E) AUC of the plasma glucose response and (F) the plasma insulin response after a glucose bolus at CT4 and CT8 after a 4‐h sleep deprivation. Black bars: control group; gray bars: sleep‐deprived group. CTR = control, SD = sleep deprived, AUC = area under the curve. AUC was calculated from t = 0 till t = 20 min. Data are presented as mean ± SEM. *P < 0.05 between CTR and SD; ## P < 0.005, # P < 0.05 between CT4 and CT8.