Figure 4.

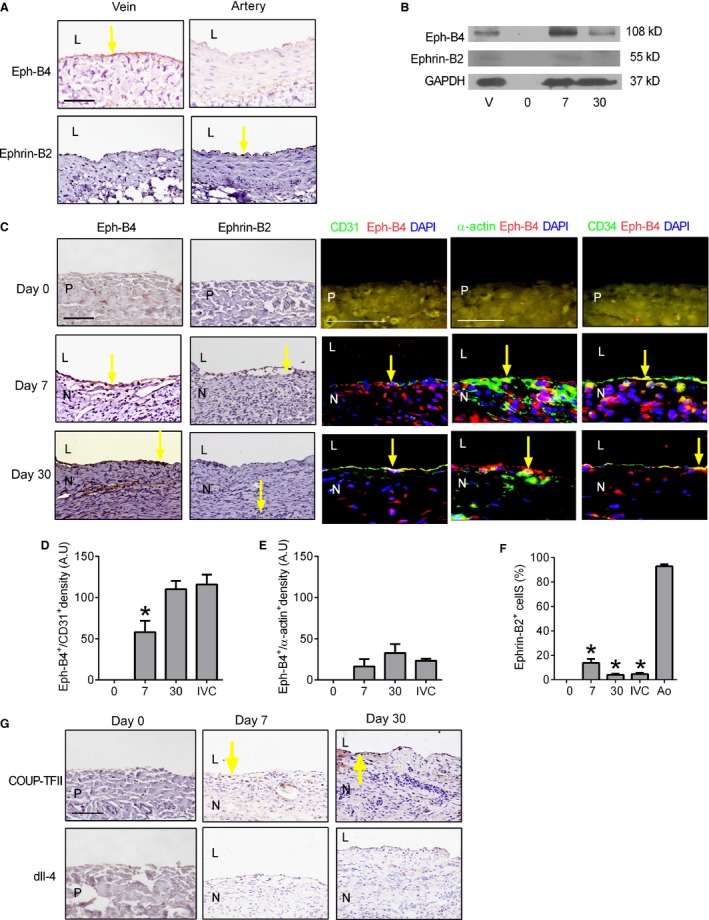
Cell identity after patch venoplasty. (A) Immunohistochemical analysis of rat control IVC (vein) and aorta (artery) for Eph‐B4 (upper row) and Ephrin‐B2 (lower row). Yellow arrow shows Eph‐B4‐positive cells in the vein and Ephrin‐B2‐positive cells in the artery; L, lumen, n = 3; scale bar, 100 μm. (B) Representative Western blot showing expression of Eph‐B4, Ephrin‐B2 and GAPDH in the control IVC (vein), preimplantation patch (day 0), and patch explanted at day 7 or day 30; n = 3. (C) Immunohistochemistry and immunofluorescence analysis of the neointima at day 0 (upper row), day 7 (middle row), or day 30 (lower row). Day 0 (upper row) shows patch without neointima. Analysis for the following: first column, Eph‐B4 (scale bar, 100 μm); second column, Ephrin‐B2; third column, merge of CD31 (green), Eph‐B4 (red) and DAPI (blue) (scale bar, 100 μm); fourth column, merge of α‐actin (green), Eph‐B4 (red) and DAPI (blue) (scale bar, 50 μm); fifth column, merge of CD34 (green), Eph‐B4 (red) and DAPI (blue) (scale bar,50 μm). P, patch; L, lumen; N, neointima. Yellow arrow shows the positive cells. n = 3. (D) Bar graph showing density of Eph‐B4 immunofluorescence in neointimal endothelial cells at day 7, day 30 and control IVC; P = 0.0002, ANOVA. *P = 0.0316, day 7 versus day 30; n = 4. (E) Bar graph showing density of Eph‐B4 immunofluorescence in neointimal smooth muscle cells at day 7, day 30 and control IVC; P = 0.0591, ANOVA; n = 4. (F) Bar graph showing percentage of Ephrin‐B2‐positive cells in neointima at day 7, day 30, control IVC and control aorta(mean number of cells counted in 4 high power fields); P < 0.0001, ANOVA. *P < 0.01; day 7, day 30 and control IVC versus control aorta (post hoc test); n = 4. (G) Immunohistochemistry showing the neointima at day 0 (left column), day 7 (second column), or day 30 (third column), stained with COUP‐TFII (upper row) and dll‐4 (lower row), yellow arrow shows the positive cells. n = 3.
