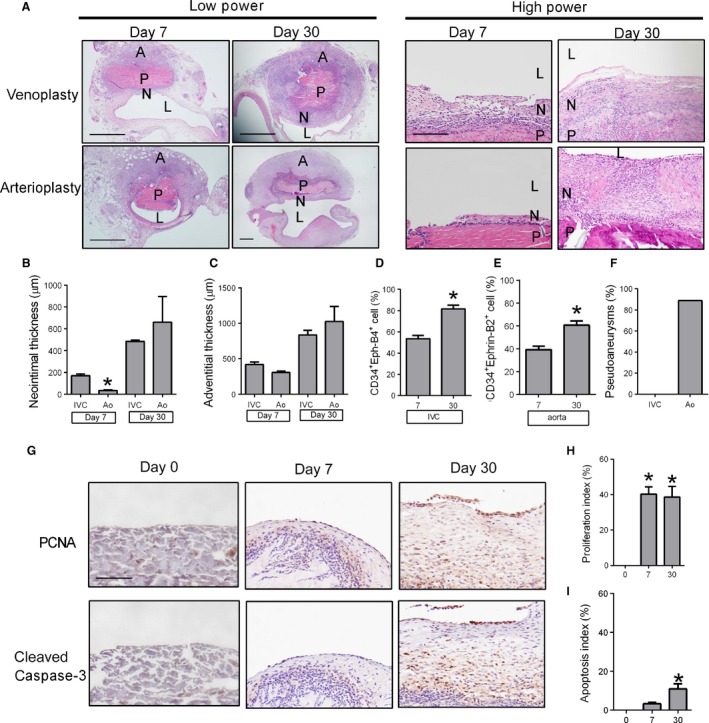
Figure 5.

Comparison of patch venoplasty and arterioplasty. (A) Comparison of patches harvested postoperative day 7 or 30 (n = 4) after venoplasty or arterioplasty (H&E staining); P, patch; L, IVC or aorta lumen; N, neointima; A, adventitia; lower power scale bar, 1 mm; high power scale bar, 200 μm. (B) Bar graph showing increased neointimal thickness after venoplasty or arterioplasty. *P = 0.0011 versus IVC (t‐test); n = 4. (C) Bar graph showing increased adventitia thickness after venoplasty or arterioplasty. n = 4. (D) Bar graph showing increased neointimal CD34+Eph‐B4+ cell percentage after venoplasty; *P = 0.0111 (t‐test), n = 4. (E) Bar graph showing increased neointimal CD34+Ephrin‐B2+ cell percentage after arterioplasty; *P = 0.0037 (t‐test), n = 4. (F) Bar graph shows the percentage of pseudoaneurysm formation around the IVC or aorta patches (n = 9). (G) Immunohistochemistry showing neointima at day 0 (left column), day 7 (middle column), or day 30 (right column); analysis for: upper row, proliferating cell nuclear antigen (PCNA); lower row, cleaved caspase‐3. P, patch; L, lumen; N, neointima. n = 4. Scale bar, 100 μm. (H) Bar graph showing neointimal proliferation index; P = 0.0009 (ANOVA). *P = 0.0013 (day 7, post hoc), P = 0.0017 (day 30, post hoc); n = 4. (I) Bar graph showing neointimal apoptosis index; P = 0.0064 (ANOVA). *P = 0.0295 (post hoc); n = 4.
