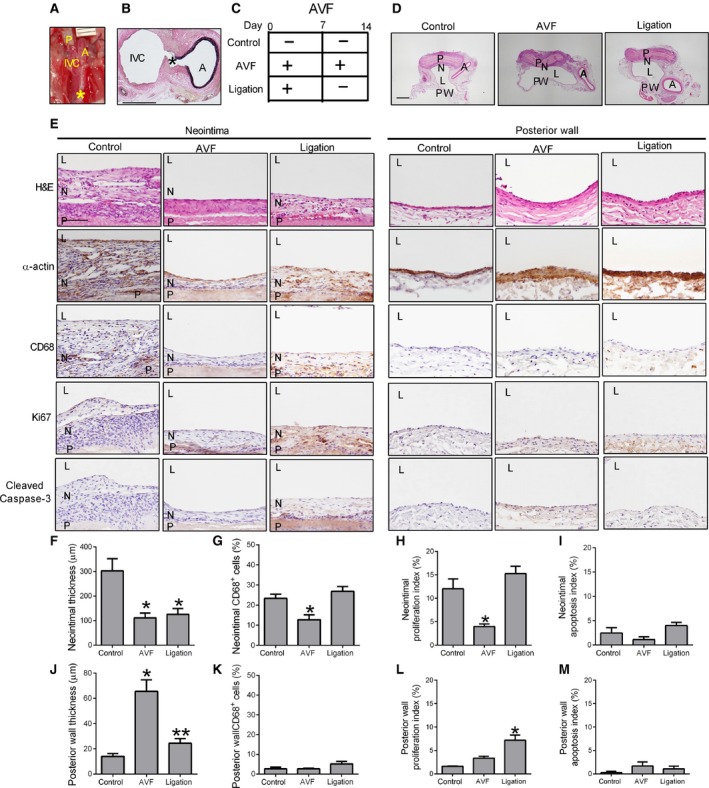
Figure 6.

Plasticity of venous neointima thickness with shear stress. (A) Operative photograph showing AVF was created immediately after patch venoplasty. P, patch; A, aorta; IVC, inferior vena cava; *, site of AVF; ruler markings are 1 mm. (B) EVG staining showing the AVF at day 14; A, aorta; IVC, inferior vena cava; *, site of AVF; scale bar, 1 mm. (C) Schematic diagram showing the 3 experimental groups. (D) Representative photomicrographs (low power) showing the different groups of patches harvested at day 14 and stained with H&E; P, patch; N, neointima; L, IVC lumen; PW, posterior wall; scale bar, 1 mm; n = 3. (E) Representative photomicrographs (H&E and immunohistochemistry) showing the neointima (left 3 columns) and the posterior vessel wall (right 3 columns), day 14; rows are examined for H&E, α‐actin, CD68, Ki67 and cleaved caspase‐3. P, patch; N, neointima; L, IVC lumen; scale bar, 100 μm; n = 3. (F) Bar graph showing the mean thickness of the neointima, day 14 (P = 0.0246, ANOVA); *P < 0.04 (post hoc test); n = 3. (G) Bar graph showing the CD68 positive cell percentage in the neointima, day 14 (cells counted in 4 high power fields), P = 0.0116, ANOVA; *P < 0.05 (post hoc test); n = 3. (H) Bar graph showing the mean neointimal proliferation index, day 14; P = 0.0052, ANOVA; *P < 0.05 (post hoc test); n = 3. (I) Bar graph showing the mean neointimal apoptotic index, day 14; P = 0.1146, ANOVA; n = 3. (J) Bar graph showing the mean thickness of the posterior wall, day 14; P = 0.002, ANOVA; *P < 0.01 (post hoc test); n = 3. (K) Bar graph showing the mean CD68+ cell percentage in the posterior wall, day 14 (cells counted in 4 high power fields), P = 0.1568, ANOVA; n = 3. (L) Bar graph showing the mean posterior wall proliferation index; P = 0.0027, ANOVA; *P < 0.05 (post hoc test); n = 3. (M) Bar graph showing the mean posterior wall apoptotic index; P = 0.3295, ANOVA; n = 3.
