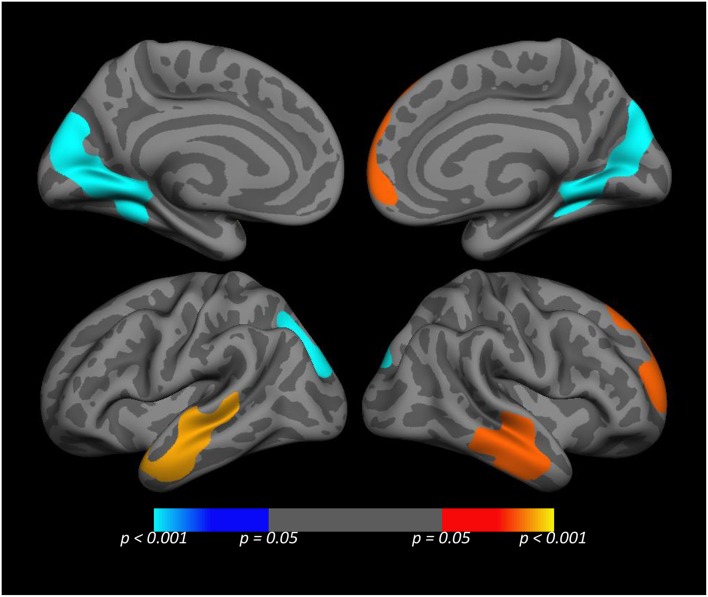
Figure 3.
Medial (top) and lateral (bottom) views of the whole cortex vertex-wise analysis of the rs977003 × PTSD diagnosis interaction. The cluster-wise significance for all clusters depicted was p ≤ 0.0051. The temporal and frontal clusters (red/yellow) correspond to components of the DMN modeled in the primary analysis. The blue cluster in the visual cortex, (which was opposite in direction relative to the temporal and frontal effects) was not detected in the primary analysis because it is not a component of the DMN.

