
Figure 5.
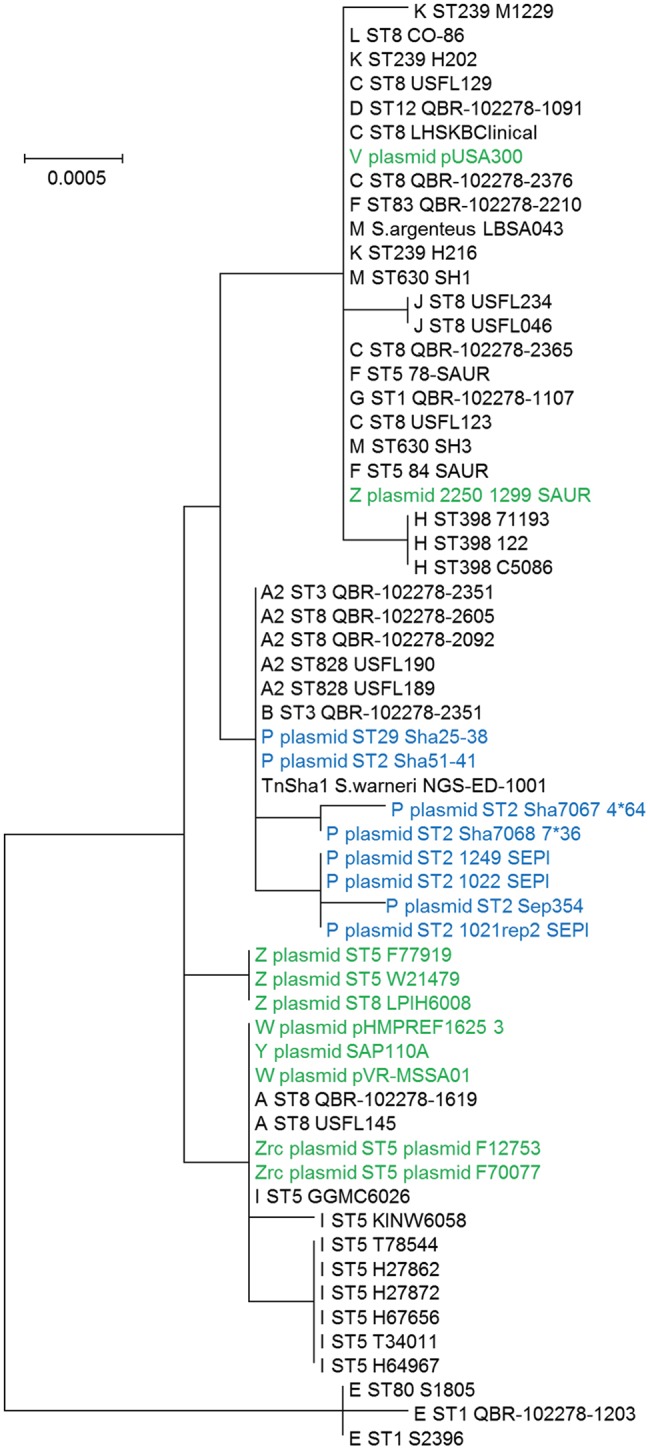
Phylogram of the TnSha1 and TnSha2 elements. The tree contains 57 TnSha1 sequences, 10 of which sequenced in this work (QBR-102278 sequences) and a subset of eight TnSha2 sequences (only the homologous part was used for tree building purposes). Each TnSha1 element is identified by its target (A–Z), followed by the sequence type (ST), and the strain name. TnSha1 elements on S. aureus plasmids are colored in green while TnSha2 elements are in blue. For GenBank accession numbers please see Tables 1, 4. The bootstrap maximum likelihood tree was obtained using MEGA6 with default parameters. The scale bar is shown in the upper left part. It should be noted that the tree is built based on only few SNPs, which distinguish the different elements.