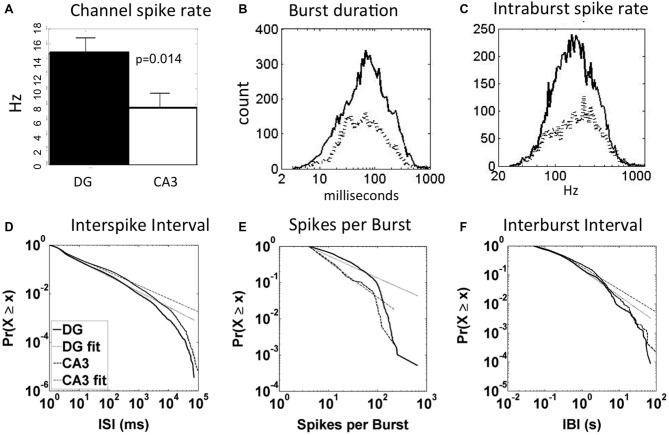
Figure 2.
Spike and burst dynamics for DG-CA3 networks distribute as log-normal and log-log relationships that highlight regional differences. (A) Larger average channel spike rate in DG than CA3 (N = 72 electrodes in DG and 59 electrodes in CA3 from five arrays). (B) Log-normal higher mean burst duration (mean on x-axis) in DG (67 ms; solid line, n = 6817 bursts) than CA3 (58 ms; dashed line, n = 3386). (C) Lower mean intraburst spike rate in DG (solid line) than CA3 (dashed line). (D) Cumulative log-log fit of interspike intervals (ISI) in DG and CA3 are similar in slope over three orders of magnitude (X is normalized total counts (total count in all bins/total count = 1); small × is counts in all bins less than the current bin) n = 5 arrays merged with 173030 spikes in DG and 70324 in CA3. (E) Log-log spikes per burst are fit well over one order of magnitude with higher spike count in DG than CA3. This panel is for one representative array. Because of large differences in the log-log distributions of spikes per burst for each array, the combination was considerably rounded and not well fit by a line. (F) Similar slopes for interburst intervals over two orders of magnitude in DG (n = 173030 spikes) and CA3 (n = 70324). Dotted lines indicate linear regions of log-log distributions.

