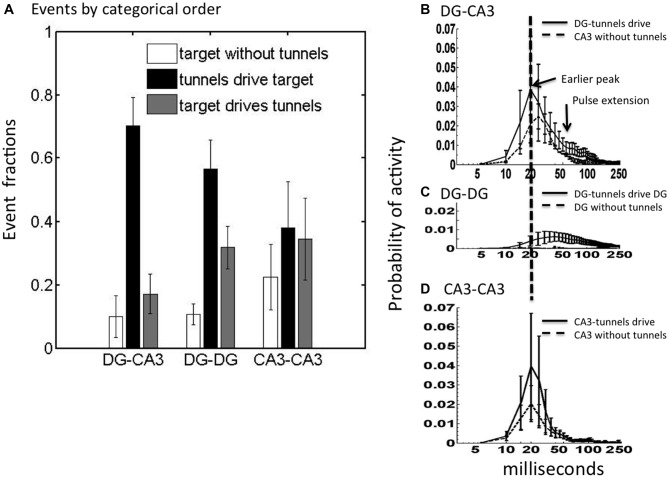
Figure 3.
CA3 is most frequently driven by tunnel activity with altered activity dynamics depending on inputs. (A) In DG-CA3, the number of CA3 events driven by tunnels was higher than other categories (ANOVA p < 0.001) as was the case for DG-DG, but not CA3-CA3. Event fractions are the event counts in each category as a proportion of the total (N = 2782 for DG-CA3; 2280 for DG-DG; 1493 for CA3-CA3). (B–D) Post-event time histograms of spiking probability for CA3 (or target) events driven by tunnel and DG activity (solid) compared to target events without preceding tunnel activity (dashed; log scale). Note higher and earlier peak for CA3 when driven by tunnels than without tunnel inputs for native DG-CA3 networks. Target events were aligned at the start of each activity event. For each array, spike count was normalized to overall spike count in the target well. Normalized spike count (spiking probability) was averaged from five arrays. Error bars indicate ±SEM.

