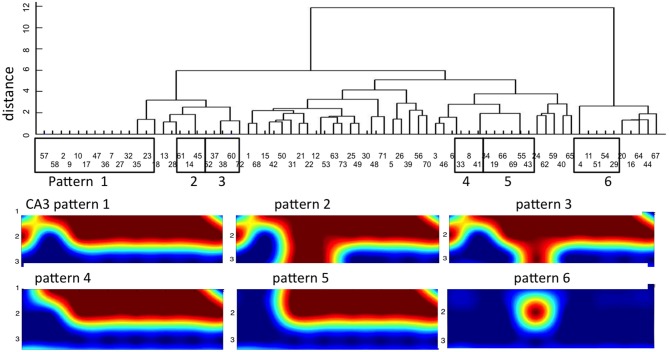
Figure 7.
Dendrogram clustering reveals distinct temporal-spatial distributions of CA3 activity for 8 tunnel inputs from DG. X-axis of event order indicates mostly non-sequential repeat patterns. Y-axis measures distance with zero equal to identical spatial patterns in CA3. Of 73 timed patterns, six groups repeat three or more times (boxed). The spatial distributions of these patterns are shown below on the 3 × 8 grid of CA3 electrodes.

