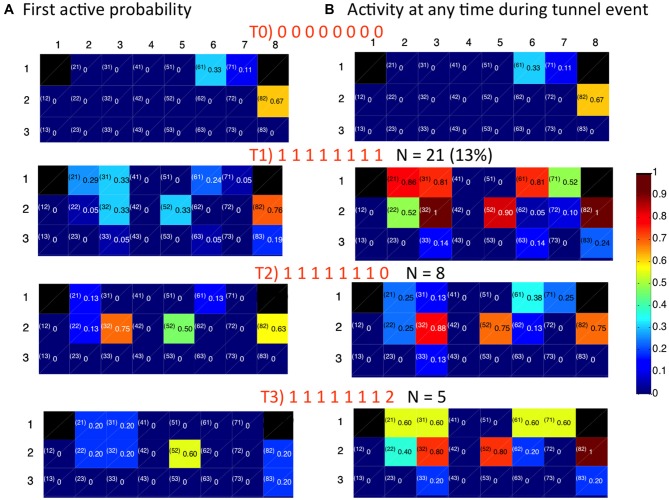
Figure 8.
Spatial distribution of activity for indicated temporal patterns of activity in 8 tunnels depend on timing and pattern of tunnel events (0 = tunnel inactive, 1 = first event (often simultaneous), 2 = second delayed event). (A) First to fire activation patterns in target CA3. Numbers are the fraction of events that an electrode was the first to be active. (B) Extent of activation in CA3. Numbers are the fraction of time each electrode is active during the indicated pattern of tunnel activation.

