Figure 2.

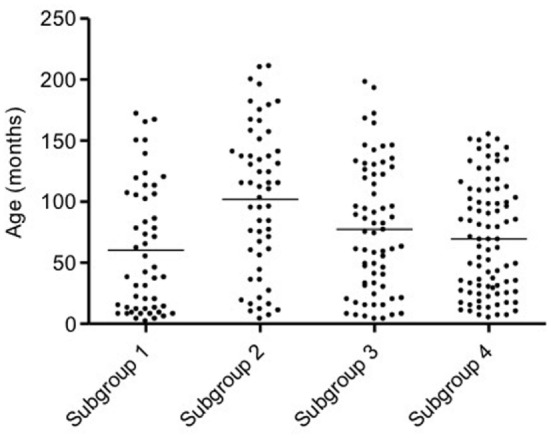
Scatter dot plot of age in the four subgroups of dogs. Dogs in subgroup 2 are significantly older than dogs in subgroups 1 and 4 (p < 0.001 and p < 0.01, respectively). The horizontal line depicts the mean.

Scatter dot plot of age in the four subgroups of dogs. Dogs in subgroup 2 are significantly older than dogs in subgroups 1 and 4 (p < 0.001 and p < 0.01, respectively). The horizontal line depicts the mean.