Figure 3.

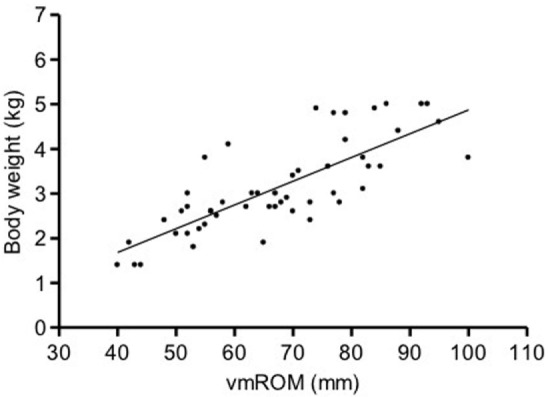
Scatter dot plot of vmROM and body weight in dogs in subgroup 1. A significant positive correlation is identified (p < 0.001). The regression line is shown.

Scatter dot plot of vmROM and body weight in dogs in subgroup 1. A significant positive correlation is identified (p < 0.001). The regression line is shown.