Figure 9.

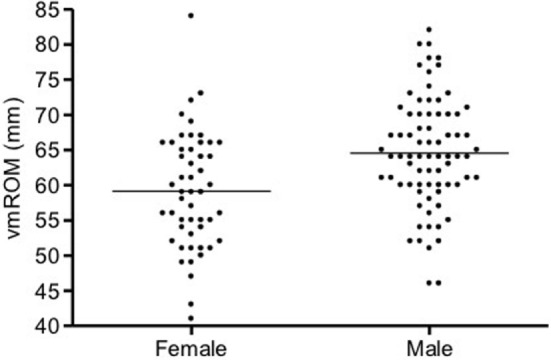
Scatter dot plot of vmROM in female and male cats. vmROM is significantly higher in male (p < 0.001). The horizontal line depicts the mean.

Scatter dot plot of vmROM in female and male cats. vmROM is significantly higher in male (p < 0.001). The horizontal line depicts the mean.