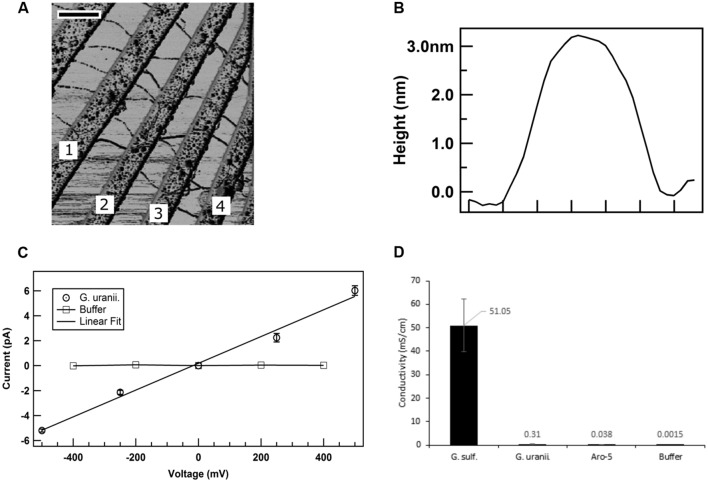
FIGURE 8.
Conductivity of G. uraniireducens pili. (A) Atomic force microscopy image of the G. uraniireducens pili bridging electrodes. Electrode pairs 1–2, 2–3, and 3–4 were used for the conductivity measurements. The scale bar represents 500 nm. (B) Diameter (height) of the G. uraniireducens pili. (C) Current–voltage response of the pili. The average value of the current from three measurements are represented as data points while the standard error is represented as the error bar. (D) Comparison of the conductivity of pili for G. uraniireducens pili and previously reported (Adhikari et al., 2016) conductivities of wild-type G. sulfurreducens and Aro-5 pili.

