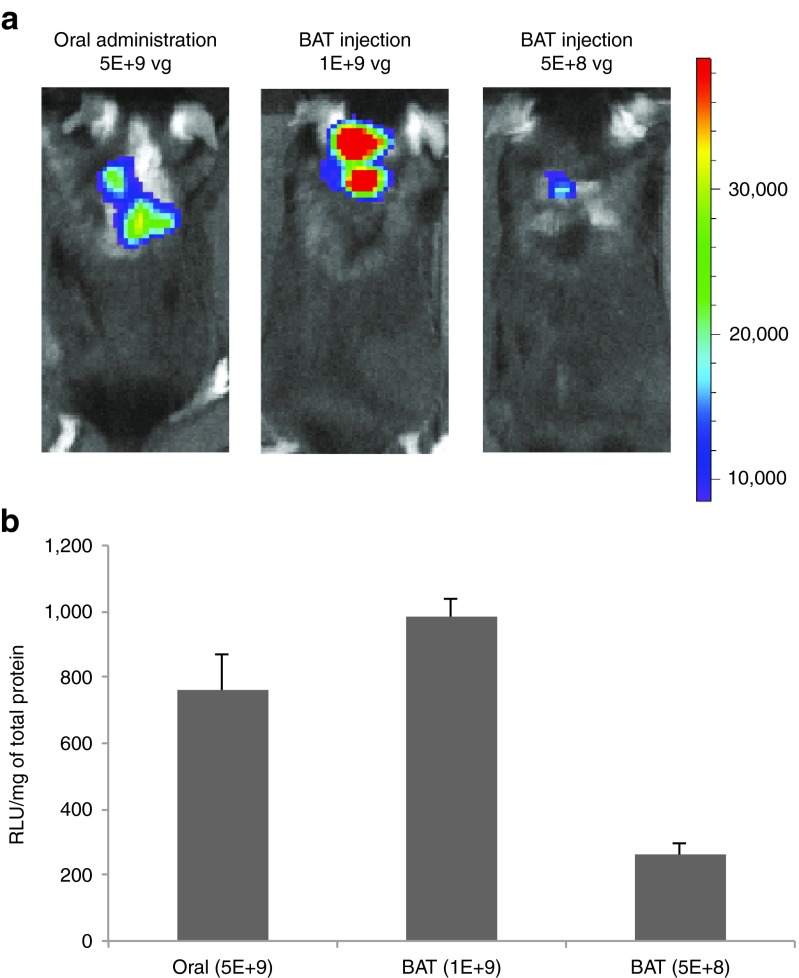
Figure 4.
Comparison of oral administration of Rec2 vector with direct BAT injection. (a) Representative in vivo bioluminescence imaging of luciferase 2 weeks post-oral administration (5 × 10⁹ vg per mouse) or direct injection to the BAT at lower doses (1 × 10⁹ vg or 5 × 10⁸ vg per mouse). Dorsal view, radiance photons/sec/cm2/sr, color scale: Min = 8.45e3; Max = 3.90e4. (b) Luciferase activity in BAT. Relative light units were calibrated to the total protein. n = 5 per group.

