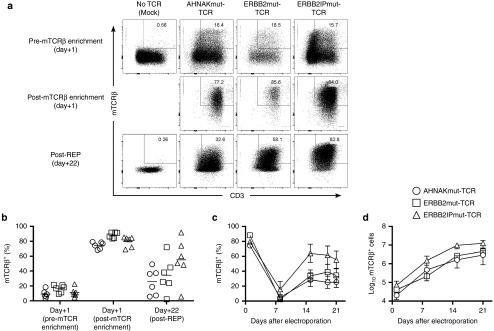
Figure 1.
Introduction, enrichment, and stable expression of mutation-specific T-cell receptors (TCRs) in peripheral blood T cells using Sleeping Beauty transposition. Peripheral blood leukocytes from patients with advanced cancer were coelectroporated with SB11 transposase and pSBSO Sleeping Beauty transposons (derivative of T2 transposon) containing mutation-specific TCRs fused to murine constant α and β chains. The following day, transposed T cells were enriched by capturing mouse TCRβ+ (mTCRβ) T cells with magnetic beads, and mTCRβ+ T cells were stimulated with a rapid expansion protocol (REP) supplemented with interleukin-2 (IL-2), IL-15, and IL-21. T cells electroporated without DNA/TCR (mock) were stimulated in parallel for negative control. (a) Evaluation of mTCRβ+ T cells following electroporation with (from left to right): No DNA/TCR (mock), AHNAKmut-TCR, ERBB2mut-TCR or ERBB2IPmut-TCR transposons. Day+1 pre- (top) and post- (middle) mTCRβ-enrichment and 22 days after expansion in REP (bottom) are displayed from 1 of 6 donors tested in two independent experiments. (b) Cumulative mTCRβ expression in AHNAKmut-TCR (circles), ERBB2mut-TCR (squares) and ERBB2IPmut-TCR (triangles) electroporated T cells (gated on live T cells; PInegCD3+) prior to enrichment with mTCRβ, post-mTCRβ enrichment and at the end of the REP (day+22). Each donor has a shape displayed for each TCR where means (n = 6) are displayed as lines. (c) Kinetics of mTCRβ expression during the REP of the three TCR transposon populations described in (b). Data are mean ± standard error of the mean (SEM) (n = 6) pooled from two independent experiments. (d) Kinetics of mTCRβ+ T cell expansion during the REP with the same TCR designations as in (b). mTCRβ+ T-cell counts at each time point were calculated by multiplying total cell counts by mTCRβ+CD3+ frequency. Data are mean ± SEM (n = 6) pooled from two independent experiments.

