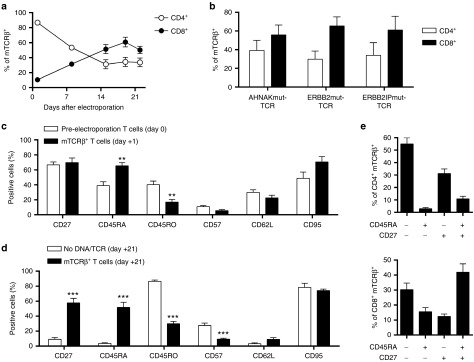
Figure 2.
Surface phenotype of T cells expressing mutation-specific T-cell receptors (TCRs). (a) Kinetics of CD4+mTCRβ+ (open circles) and CD8+mTCRβ+ (closed circles) frequencies during the REP. (b) Frequency of CD4+ (open bars) and CD8+ (closed bars) T cells within the mTCRβ+ gate for each TCR population on day+19. (c) Surface expression of memory markers on T cells (CD3+) on peripheral blood mononuclear cells prior to electroporation (open bars) or CD3+mTCRβ+ T cells at day+1 postelectroporation (closed bars). (d) Surface expression of memory markers on T cells (CD3+) expanded in parallel to TCR transposed T cells from mock (No DNA/TCR) electroporations (open bars) or CD3+mTCRβ+ T cells (closed bars) at day+21 postelectroporation. Student's two-tailed t-test for comparisons between mock and mTCRβ groups for each marker in (c) and (d). **P < 0.01 and ***P < 0.001 (e) Frequency of CD45RA and/or CD27 expression in CD4+mTCRβ+ (top) or CD8+mTCRβ+ (bottom) T cells. Data were mean ± standard error of the mean (n = 6 for (b) and (c) closed bars and n = 18 (six donors with three TCRs) for all other graphs). Data were pooled from two independent experiments.

