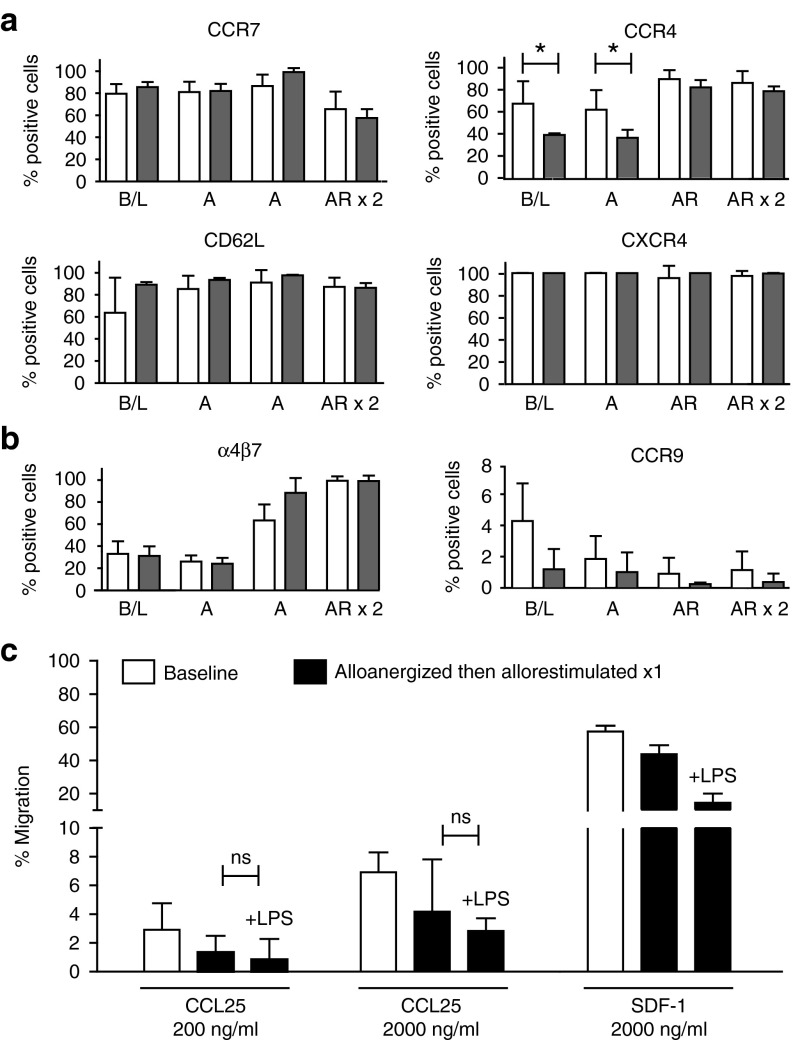
Figure 4.
Regulatory T-cells (Treg) expanded after alloanergization and allorestimulation display differential expression of molecules conferring organ-specific migratory capacity. (a) Mean frequencies (±SD) of cells expressing CCR7, CD62L, CCR4 and CXCR4 expressed as a proportion of Treg at baseline (B/L) and after alloanergization (A) and subsequent allorestimulation (AR) in the absence (white bars) or presence (gray bars) of lipopolysaccharide (LPS) (n = 3–9). *P<0.05, (b) Mean frequencies (±SD) of cells expressing α4β7 and CCR9 expressed as a proportion of Treg at B/L and after A and subsequent AR in the absence (white bars) or presence (gray bars) of lipopolysaccharide (LPS) (n = 3–9). (c) CCL25 and SDF-1-specific chemotaxis of CD4+ Treg from baseline and after alloanergization and restimulation in the absence or presence of LPS. Bar charts depict mean (±SD) data from three different stimulator-responder pairs. ns, not significant.

