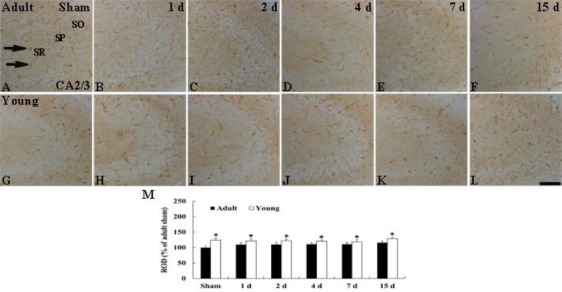
Figure 4.

Immunohistochemistry for GLUT-1 in the CA2/3 region of the adult (upper column) and young (lower column) groups of the sham- (A and G) and ischemia-operated- (B-F, H-L) groups. GLUT-1-immunoreactive microvessels (arrows) in the young sham-group are is higher in density than to those in the adult sham-group. In both ischemia-operated-groups, distribution patterns of GLUT-1-immunoreactive microvessels in the CA2/3 region are not significantly changed after ischemia-reperfusion. SO, stratum oriens; SP, stratum pyramidale; SR, stratum radiatum. Scale bar = 50 µm. M: ROD as % of GLUT-1-immunoreactive structures in the adult and young groups (n= 7 per group; *P < 0.05, significantly different from the young sham-group). The bars indicate the means ± SEM
