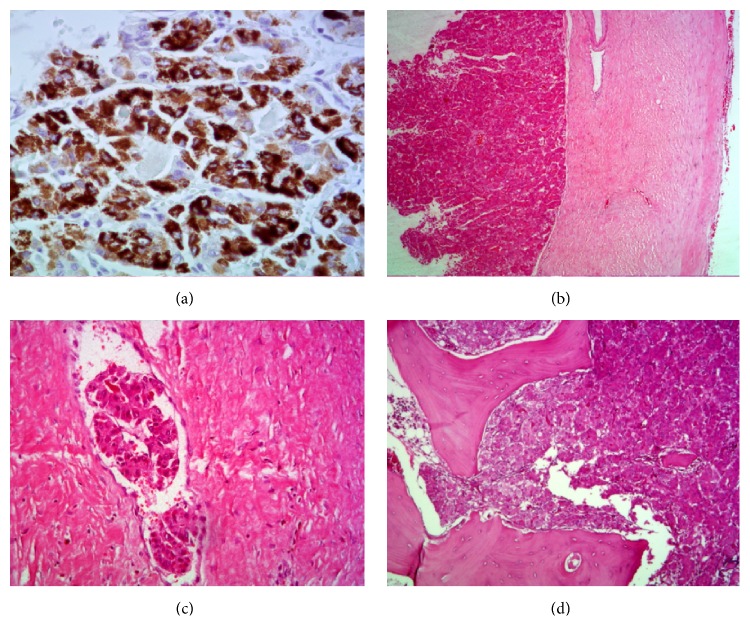
Figure 2.
Photos of the hepatocarcinoma pathological structures and MRI image. (a) Hepatocyte. Typical hepatocellular carcinoma cells. 200x. (b) H/E. Tumor cells on the left and intact dura mater on the right. 25x. (c) H/E. Clumps of tumor cells within vascular spaces, demonstrating the tumor bloodstream dissemination. 100x. (d) H/E. Typical hepatocellular carcinoma. 100x.

