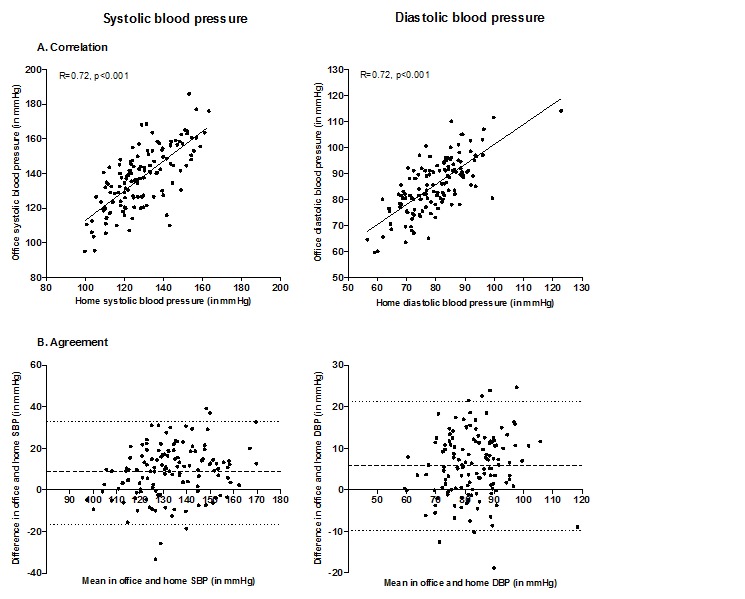
Figure 2.

Association between blood pressure measurements at home and in the study center. Abbreviations: R, Pearson’s correlation coefficient; SBP, systolic blood pressure; DBP, diastolic blood pressure. Panel A shows the home blood pressure (mean of two consecutive measurements in both morning and evening at day 2, 3 and 4, x-axis) and corresponding study center blood pressure measurements (mean value of two consecutive measurements, y-axis) for each participant. Panel B shows the agreement between study center and home systolic and diastolic blood pressure measurements.
