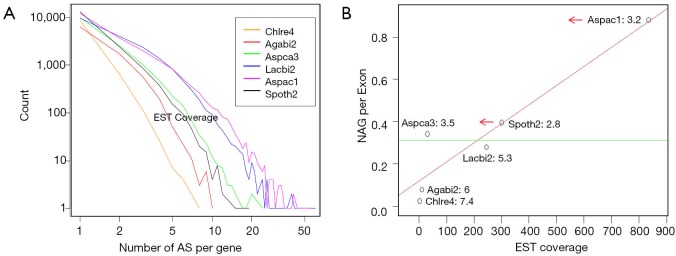
Figure 1.
Distribution of NAG and its suppression in exon rich genomes. (A) Distribution of NAG. Both axes are in log scale. (B) Suppression of NAG per exon in intron-rich genomes. The red line is the regression line with R-squared =0.8845. Horizontal arrows indicated that the effective EST coverage is less than the real values owing to shorted input sequences (Spoth2), and extremely high coverage (Aspac1). The green horizontal line separates the intron-rich and intron-poor genomes. The number after the genome abbreviation is the number of exons per model computed from the representative models.

