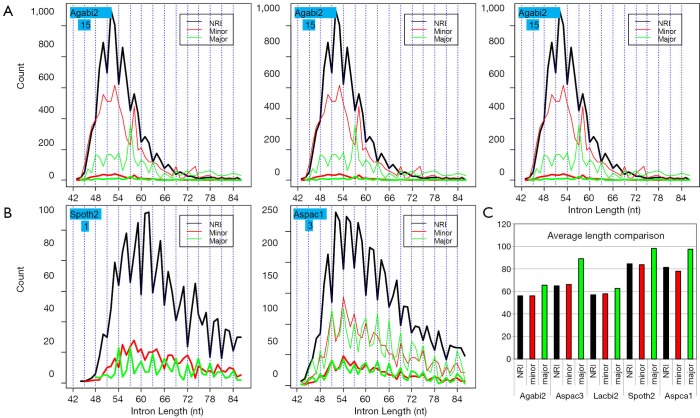
Figure 5.
Comparison of stopless intron length distributions from different RI types. (A) Basidiomycota. (B) Ascomycota. Only the peak regions are shown. Vertical lines mark 3n length. Colors: black for NRI, red for minor RI, and green for major RI. The thinner red and green lines are amplified by numbers underneath the genome name (top left corner of each graph) from the corresponding thicker lines respectively. (C) An average stopless intron lengths (nt). The stopless intron length t-test between major and other two RI types showed significant differences for all genomes (P value range from 4.8×10⁻⁵ to 8.8×10⁻¹³).

