
Figure 4.
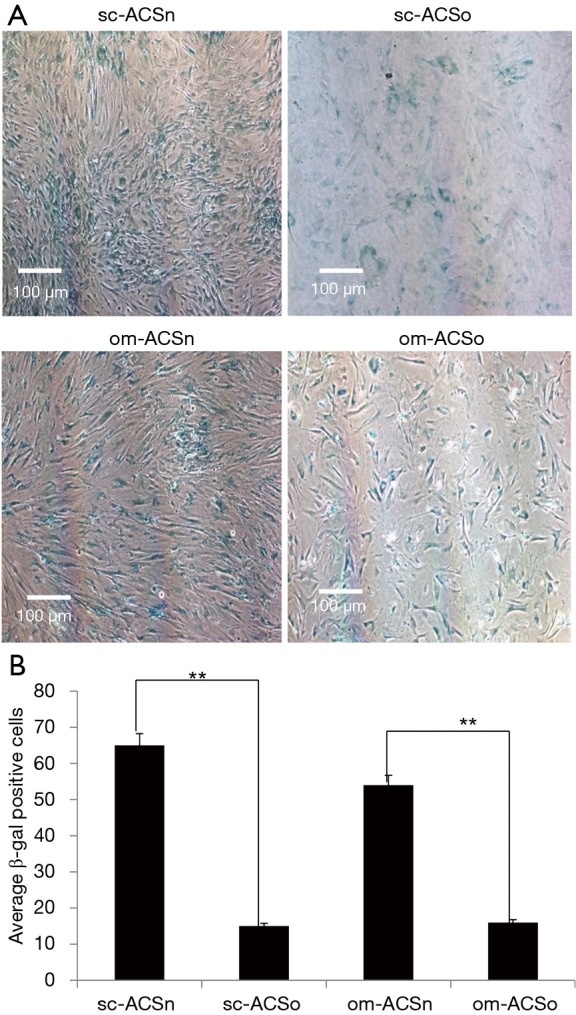
Senescence in ASC. (A) sc-ASCn, om-ASCn, sc-ASCo and om-ASCo were stained for β-galactosidase to detect senescence. Cells were then visualized under 4X light microscopy using Nikon Eclipse microscope. The percent of cells staining positive was calculated by counting five areas of the same size from each field per sample using NIS elements advance research image tool software. (B) The graphs show average of β-gal positive cells. Statistical analysis performed by two-tail Student’s t-test. **, P<0.01.