Figure 6.
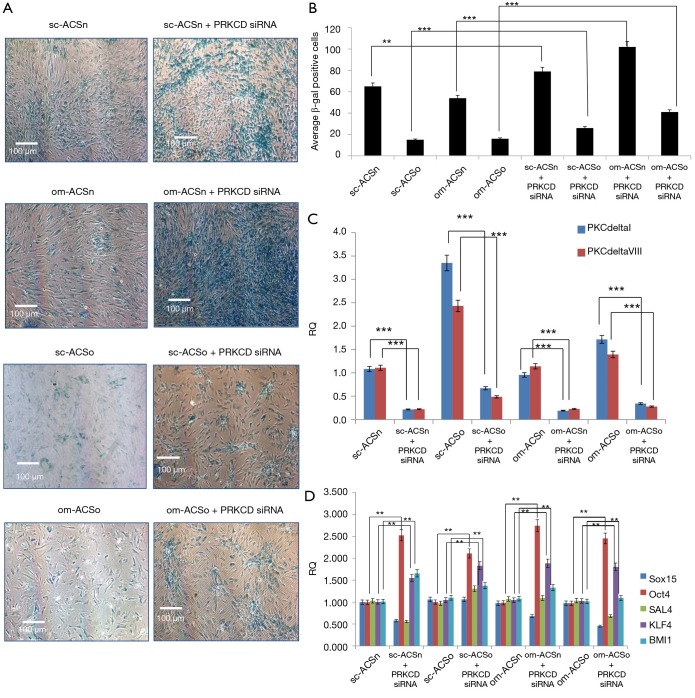
Senescence in ASC. (A) sc-ASCn, om-ASCn, sc-ASCo and om-ASCo were transfected with 50 nM PRKCDsiRNA for 48 h. Cells were stained for β-galactosidase to detect senescence. Cells were then visualized under 4× light microscopy using Nikon Eclipse microscope. The percent of cells staining positive was calculated by counting five areas of the same size from each field per sample using NIS elements advance research image tool software. (B) The graphs show average of β-gal positive cells. Statistical analysis performed by two-tail Student’s t-test. (C) Total RNA was isolated and real time qPCR was performed using PKCδI and PKCδVIII primers. The graph shows relative quotient (RQ). Statistical analysis performed by two-tail Student’s t-test. (D) Total RNA was isolated and real time qPCR was performed using transcription factor Oct4, Sal4, Sox15, KLF4 and BMI1 primers. The graph shows relative quotient (RQ). Statistical analysis performed by two-tail Student’s t-test. **, P<0.01; ***, P<0.001.

