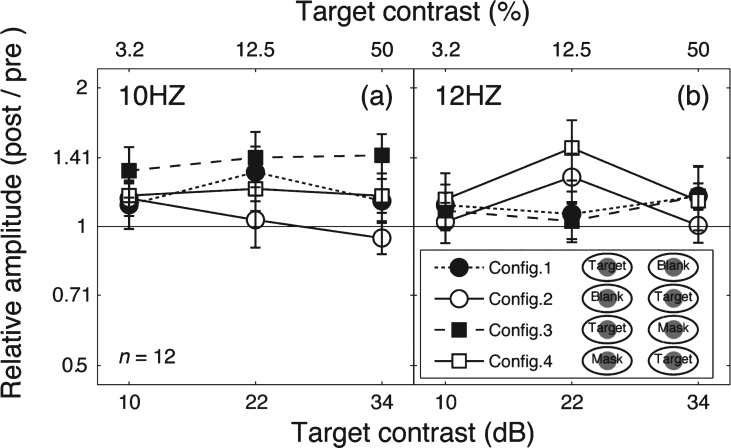
Fig.4.
Change of SSVEP amplitudes after patching. Relative SSVEP amplitude (Post/pre) plotted against target contrast for the four viewing conditions. Points above the middle identity line indicate increasing of response after 2.5-hour patching. Error bars give±1 standard error across observers (n = 12).

