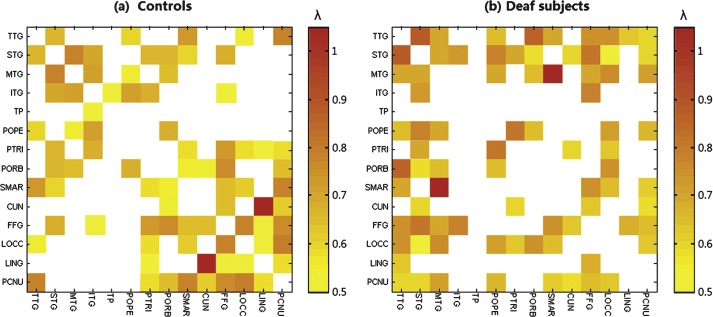
Fig.2.
Grey matter connectivity matrix with 40 connections over a total of 91 connections suggesting a quasi-measure for the strength in (a) normal controls and (b) deaf subjects respectively. The value in the matrix is the critical λ at which two brain regions change from being connected to being not connected. The colorbar represents the critical λ. The larger the value is, the stronger strength it indicates..

