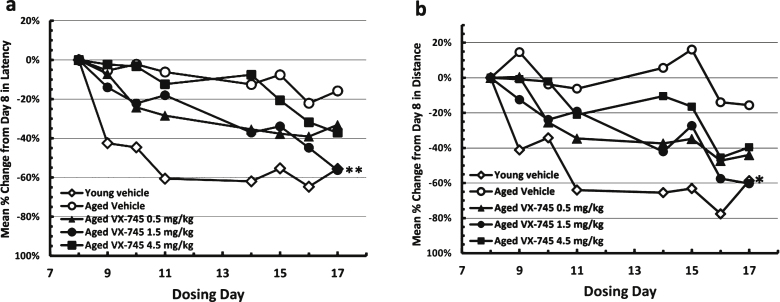
Fig.3.
Normalized Morris water maze test results during acquisition phase. Results in vehicle-treated young rats and aged rats treated with 0.5, 1.5, or 4.5 mg/kg VX-745 shown as Latency (c) and Distance (d) as percentage change from initial testing results at day 8. **p < 0.01 and *p < 0.05 by t-test for latency and distance, respectively, for 1.5 mg/kg VX-745 versus aged-vehicle treated rats at last day of testing.

