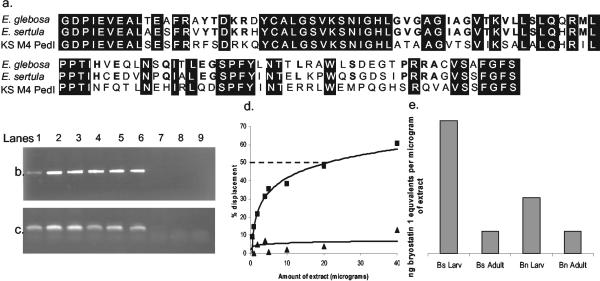
FIG. 4.
(a) Alignment of EgleKSa (accession number AY532643) with “Candidatus E. sertula” KSa (AF283572) and KS from module 4 of PedI (Z14098). Conserved residues among three sequences have black backgrounds, and conserved residues between EgleKSa and “Candidatus E. sertula” KSa are in bold. (b and c) PCR survey of “Candidatus E. glebosa” 16S rRNA (b) and “Candidatus E. glebosa” KSa (c). Lanes 1 to 6 show amplification of both genes from various B. simplex populations (1, B. simplex larvae 2001; 2, B. simplex 2001 colony 1; 3, B. simplex 2001 colony 2; 4, B. simplex 2002 colony 1; 5, B. simplex 2002 colony 2; 6, B. simplex 2003 colony 1). Lanes 7 to 9 show lack of amplification from B. neritina, B. stolonifera, and B. turrita. (d) Representative PdBU assay plots of B. simplex (square) and B. stolonifera (triangle) extracts. The dashed line shows 50% displacement. (e) The graph shows bryostatin 1 equivalents in B. neritina (Bn) and B. simplex (Bs) adult and larval (Larv) extracts (IC50 of bryostatin 1 is 1.2 ng).

