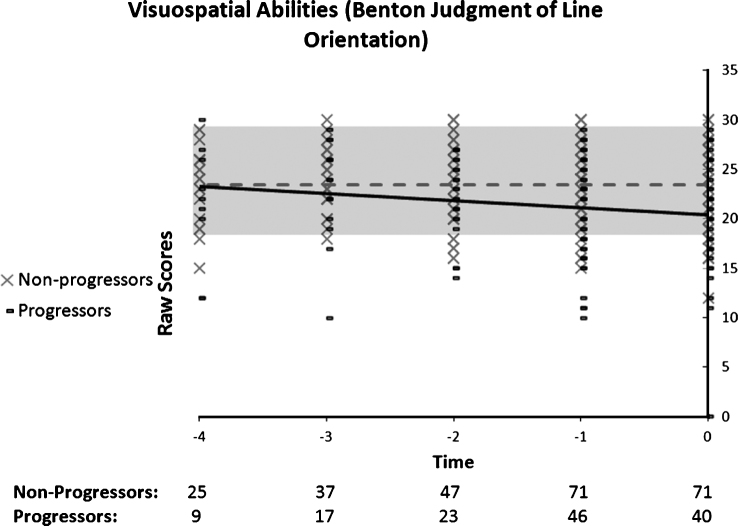
Fig.8.
Performance on the Benton Judgment of Line Orientation as a function of time to diagnosis (for progressors) or on the last 5 cognitive assessments (for non-progressors). A linear function best describes the distribution for the progressors: black line. No significant model is found in the non-progressors: dotted grey line.

