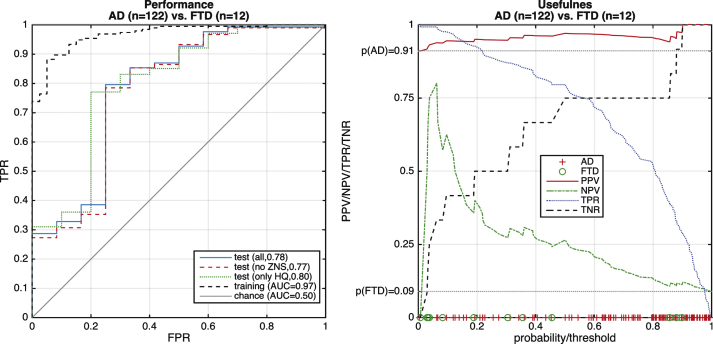
Fig.5.
Performance of differential diagnosis of FTD versus AD. Left: ROC curve, where the dashed black line indicates the cross-validated result from the training data and the solid blue line the test result. Red and green dashed lines illustrate the performance when cases are restricted to those with high quality (HQ) or cases without comorbid brain disorders (no comorb). Right: Indication of usefulness in terms of PPV and NPV. Markers on the x-axis indicate FTD (green circles) and AD (red crosses).

