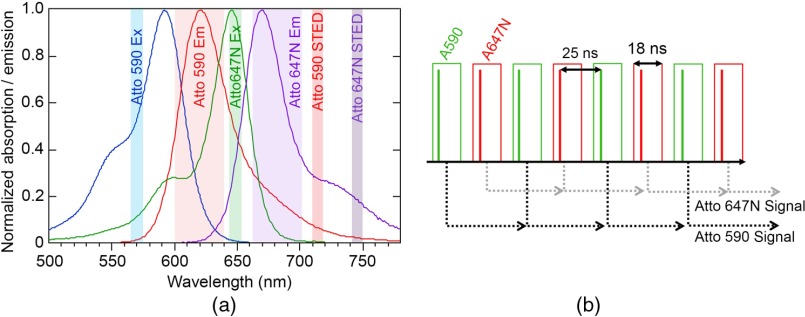
Fig. 1.
(a) Absorption and emission spectra of Atto 590 and Atto 647N, the two colors used in the STED, are shown, along with the excitation and STED laser wavelengths used. Emission detection bands shown are 600 to 640 nm for Atto 590 and 660 to 700 nm for Atto 647N. (b) Interleaved excitation/STED pulses for each color in the time domain and an illustration of the temporal gated collection are shown. Green boxes indicate the gates for the Atto 590 signal and the red boxes indicate the gates for the Atto 647N signal. The output signal from each gating circuit is sent to the computer.

