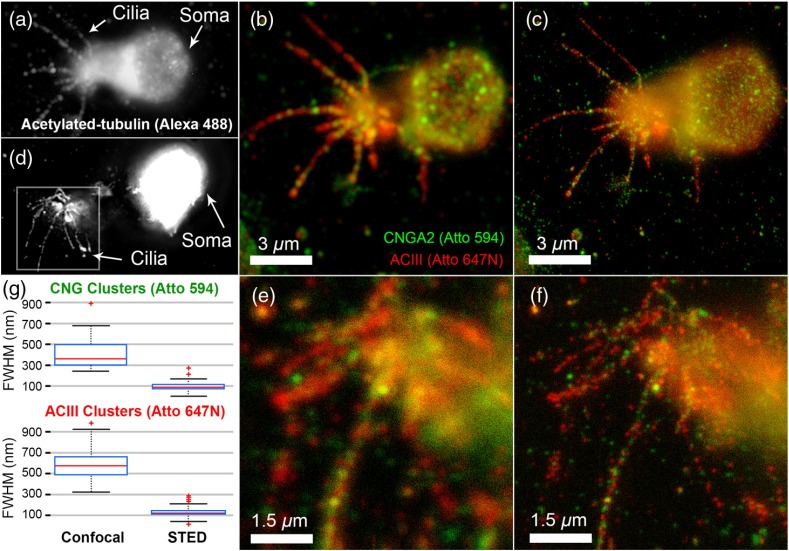
Fig. 6.
Two-color STED images of OSNs labeled for ACIII, CNGA2, and acetylated tubulin. Panel (a) and (d) show the widefield epifluorescence images of the OSN labeled with Alexa Fluor 488 against acetylated-tubulin, while panel (b),(e) and (c),(f) show the two-color images in confocal and STED, respectively, with green indicating Atto 594-labeled CNGA2 and red indicating Atto 647N-labeled ACIII. (g) Boxcar plots for clusters on OSN cilia, combining clusters on both OSNs. Top: Atto 594 channel STED enhancement, showing the decrease in imaged cluster FWHM in going from confocal (, ) to STED (, ). Bottom: Atto 647N channel STED enhancement, confocal (, ) and STED (, ). The FWHM was calculated from a rotated 2-D Gaussian fit to () ROIs that were centered on the peaks of clusters. All images taken with pixel size: 9.8 nm, pixel dwell time: 30 microseconds and total imaging time: 3:56.

