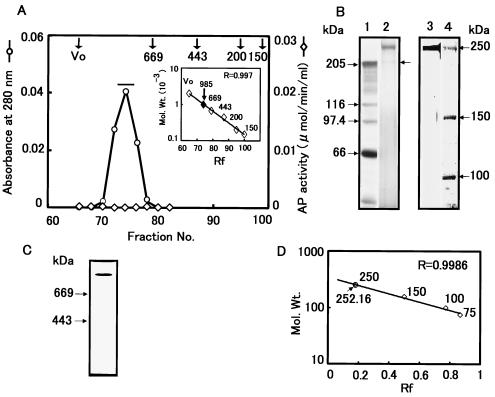
FIG. 3.
Sephacryl S-300 gel filtration chromatography of P252. (A) Fractions 52 to 64 collected from the DEAE chromatography shown in Fig. 2 were further chromatographed using a Sephacryl S-300 column. The elution profile represents the third of three sequential S-300 fractionation steps. A molecular size calibration standard curve derived using thyroglobulin (669 kDa), apoferritin (443 kDa), β-amylase (200 kDa), and alcohol dehydrogenase (150 kDa) is shown as an inset of panel A. (B) SDS-PAGE of P252 derived from Sephacryl S-300 chromatography from panel A. Lane 1, protein molecular mass markers; lane 2, sample from a pool of fractions 73 to 76 from the absorbance peak designated by the horizontal bar in panel A; lane 3, sample from lane 2 following gel purification; lane 4, protein molecular mass markers. Proteins were visualized by silver staining. (C) Native PAGE of purified P252. The gel was silver stained to determine the purity of the P252 preparation. (D) Determination of molecular weight of P252 by SDS-PAGE. A calibration curve derived from SDS-PAGE molecular weight standards run in parallel with the S-300 fractionated product was used to determine the molecular weight of P252.

